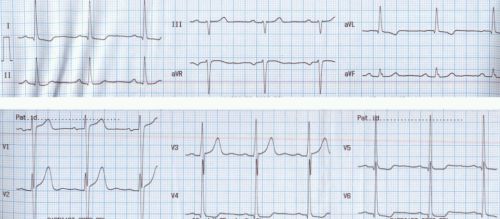
Left ventricular hypertrophy
Click on the image for an enlarged view

Left ventricular hypertrophy is manifest in this ECG as tall R waves in lateral leads (leads I, aVl, V5 and V6). S wave in V1 is 2.5 mV and R wave in V6 is 2.2 mV, with a total of 4.7 mV, which is well beyond the 3.5 mV cut off for diagnosis of left ventricular hypertrophy by voltage criteria. Voltage criteria for left ventricular hypertrophy is more sensitive, but less specific. Voltage may be enhanced in thin chest wall as in children. In addition there is early strain pattern in the form of ST segment depression and biphasic / inverted T waves in lateral leads. Strain pattern in left ventricular hypertrophy is a feature of pressure overload of the left ventricle. In volume overload conditions like aortic regurgitation, tall R waves in leads oriented to the left ventricle (V5, V6) is associated with small narrow q waves in this leads and tall T waves. Pressure overload is seen in severe systemic hypertension, aortic stenosis and hypertrophic obstuctive cardiomyopathy. Pressure overload is also known as systolic overload and volume overload as diastolic overload.


